Architecture
This is a description of the debugger architecture in Visual Studio Code.
Debugger overview
Visual Studio Code implements a generic user interface to debuggers. A developer needs to learn only one user interface to use any debugger supported by VS Code. For example, using the debug toolbar

a developer can run the program to a breakpoint, step over a function call, step into a function call, step out of a function call, restart the program, and stop the program. Adding a new debugger to VS Code involves writing a new VS Code extension that tells VS Code how to drive the debugger.
The debugging architecture of Visual Studio Code is described in the Debugger Extension guide. In this architecture, a debug adapter sits between VS Code and the debugger.
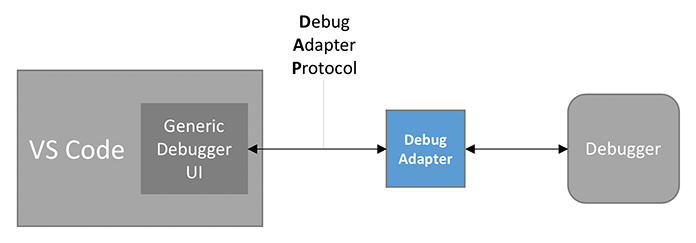
The role of the debug adapter is to receive a request from VS Code, to drive or interrogate the debugger on behalf of VS Code, and to send an appropriate response back to VS Code. The debug adapter also sends events to VS Code when certain events happen within the debugger (for example, when the debugger comes to a stopping point).
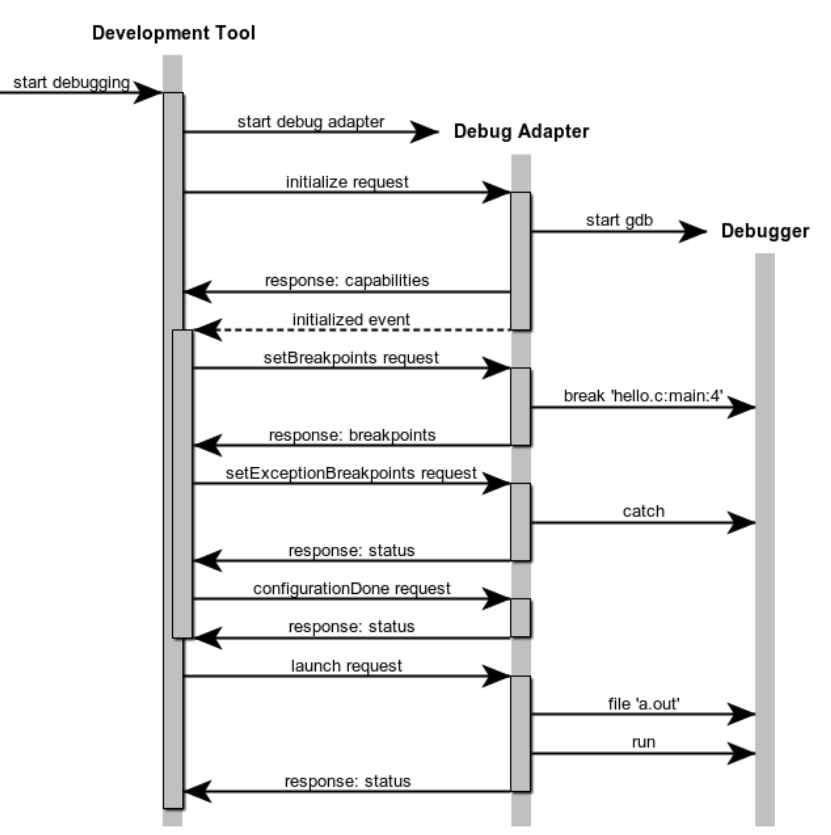
VS Code communicates with the debug adapter using the Debug Adapter Protocol. The protocol specification defines the set of requests, responses, and event notifications sent between VS Code and the debug adapter. The protocol overview gives a nice example of a sequence of requests and events that might be sent between VS Code and a debug adapter for gdb:
Debugger documentation
The user documentation is the place to start if you are unfamiliar with Visual Studio Code. The user guide introduces the basic concepts like editing and debugging. Most important are
- The debug actions that a software developer uses to interact with a debugger.
- The debug configuration that a software developer uses to select a debugger.
The developer documentation is the place for extension developers to start. Most important is
- The debugger extension overview gives a fairly complete example of how to write and package a debugger extension. The code repository used in that example was the starting point for this debugger.
You should now be able to read the code implementing this debugger, but you will eventually want to skim
-
The Extension Guides that describe the Visual Studio Code Extension APIs. This debugger uses
- Tree Views to display the code issues having traces available for debugging.
-
The UX Guidelines that describe the Visual Studio Code user interface. This debugger uses
- Views as containers of the content that appears in sidebars and panels,
- Sidebars and Panels to display views, and
- Notifications to display progress and error messages.